Image Quality Assessment
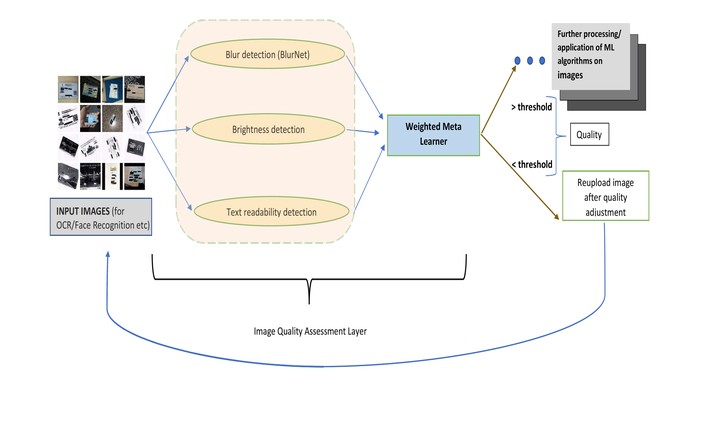 A flow chart diagram depicting the IQA model and its position in the overall product pipeline
Many of the vision based applications or APIs meant for information retrieval/data verification such as Text extraction or face recognition need a minimal quality of image for efficient processing and adequate performance. Hence it becomes imperative to implement an Image quality assessment layer before proceeding with further processing. This will ensure smooth applicaton of the vision algorithms, reliable performance and an overall time reduction by ensuring less redundant computations on oor quality images, and prventing multiple requests and passes through the algorithm.
This additional filter helps by ensuring only optimal quality images are passed on and poor quality images are screened at the client/user stage itself saving the users time and the server unnecessary processing, ensuring higher throughput and efficiency.
We implemented one such pipeline using an ensemble of models that qualitatively analysed images and produced a quantitative measure for image quality that could then be used as a threshold for decision on whether they are sent for downstream processing or the user is notified to repeat the request with better quality images. This quantitative score ensures flexibility for different tasks and different people tailored to their needs.
The model detects the blur in an image( BlurNet ), brightness of the image(a ResNet-18 model trained for binary classification i.e dark vs bright) and the text readability(based on performance of text detection and OCR algorithms along with other filtering and morphological operations on the image to estimate textual region) and a meta layer performed computation on their individual outputs to provide a final cumulative Image Quality Score.
The final meta learner was trained taking the outputs of individual models as input with the average image quality scores assigned to each image by annotators being the output score. The annotation was done by assigning each image to atleast five random users and asking them to score the image on the three parameters i.e Blur, Brightness and readability out of 10 solely on their personal discretion. These scores were then fit into a weighting formula to generate a cumulative score. This final score obtained from all the annotators for each image was averaged to output the final ground truth score for the image.
The clients get both the final score as well as outputs from each individual model along with a short description about the image quality based on the score for analysis.